What makes two homes a few blocks apart sell for very different prices? In Santa Cruz, the micro-neighborhood you choose can change what you pay per square foot, how long a listing sits on the market, and how many buyers you compete against. If you are weighing Westside, Seabright, Midtown, Downtown, Beach Flats, or Pleasure Point, it helps to understand the value drivers and tradeoffs in each area.
In this guide, you will see how location, housing mix, buyer demand, and environmental rules shape home values across Santa Cruz. You will also get a simple checklist of data to request before you make an offer or price a listing. Let’s dive in.
What drives value in Santa Cruz
Location and amenity premium
In Santa Cruz, proximity to the water and walkable amenities often commands a premium. Beachfront and immediate coastal access in places like Seabright, Pleasure Point, and parts of the Westside typically lift prices per square foot due to views, surf access, and lifestyle demand. Walkability to shops, restaurants, and services near Downtown and parts of Midtown also boosts resale appeal for buyers who value urban conveniences.
Bottom line: The closer you are to the beach or a vibrant commercial core, the more you can expect to pay for each square foot.
Supply and housing mix
Neighborhoods with larger lots and a higher share of single-family homes, such as many Westside pockets and select Pleasure Point blocks, often have tighter inventory and stronger value retention. Areas with a mix of small-lot homes, multifamily buildings, or more renter households, including parts of Midtown and Beach Flats, tend to offer lower entry prices and faster turnover. These areas can show more price volatility because small samples and varied property types make comps less uniform.
Bottom line: Limited new supply supports prices. Mixed-use and higher-density pockets can be more affordable but may trade more quickly and fluctuate more.
Who is buying where
Near beaches and tourist corridors, vacation and second-home buyers, along with short-term rental investors, add competition and can push prices higher. Family-focused buyers often seek neighborhoods with parks and convenient school access, which can increase demand in residential areas like the Westside. Commuting patterns matter too. Buyers who travel over Highway 17 consider drive time, while remote work continues to expand the pool of lifestyle buyers who favor coastal living.
Bottom line: The buyer pool shifts by micro-neighborhood, which affects both pricing power and days on market.
Environmental and regulatory factors
Coastal homes can face flood zones, bluff erosion, and sea-level rise exposure. These risks can increase insurance costs, complicate financing, and trim the number of eligible buyers. City and state rules also matter. Local coastal permitting can slow or limit expansions near the water, which can support scarcity premiums. Short-term rental ordinances influence investor demand near the Boardwalk area, Seabright, and Pleasure Point. State housing laws like SB9 and streamlined ADU rules may add future supply in some single-family areas, though coastal rules can limit impact near the beach.
Bottom line: Climate exposure and policy shape both long-term value and resale liquidity.
Micro-neighborhood snapshots
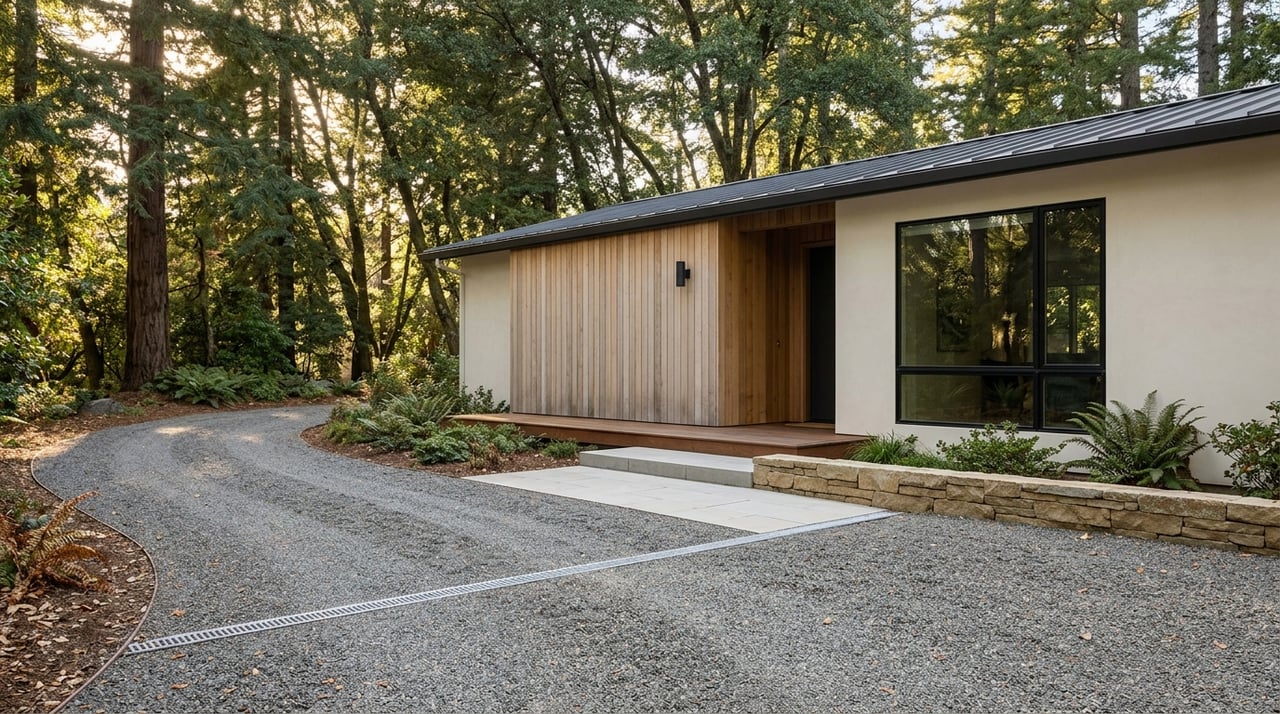
Westside
Tree-lined residential streets, a mix of historic homes and remodels, and convenient access to beaches and Natural Bridges define the Westside. Many blocks feature larger lots and a strong single-family presence, which tends to support price per square foot and lower inventory. If you want a home with yard space and consistent demand, this area often delivers.
What to watch: Infill potential is limited in many blocks, so competition for larger lots can be intense. Compare price per square foot by proximity to the coast and adjust for condition and lot size.
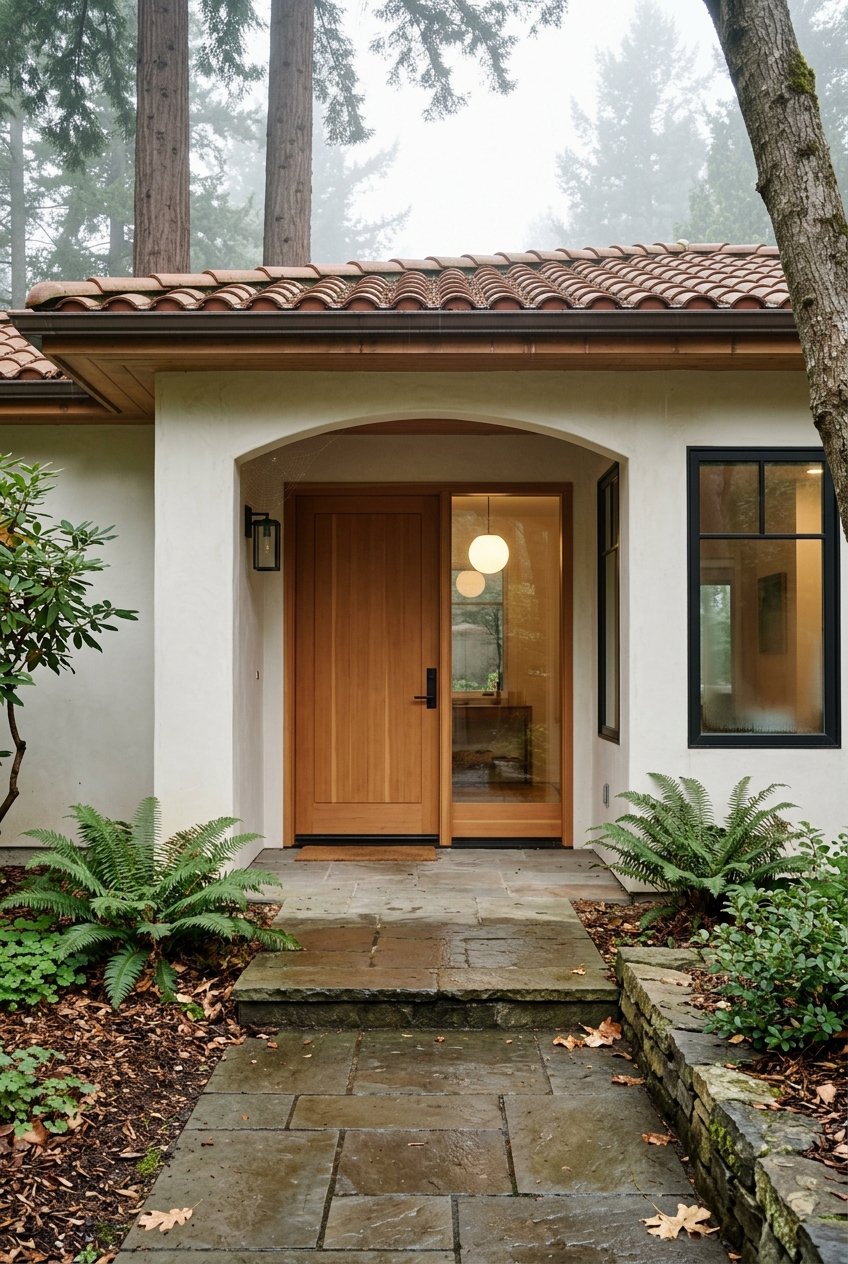
Seabright
Seabright offers immediate beach access and an easy coastal lifestyle, with older cottages and bungalows sprinkled throughout. Seasonal demand, second-home interest, and vacation appeal can lift prices and reduce days on market for well-presented listings. Salt air and moisture can affect structures, so property condition and maintenance history matter.
What to watch: Flood exposure, potential Coastal Commission constraints, and insurance costs can impact financing and resale timelines. Sales samples can be small, so smooth your comps over a longer window when possible.
Midtown
Midtown sits between downtown and eastern neighborhoods along the Mission–Soquel corridor and mixes residential streets with commercial nodes. Buyers often view it as a central, good-value option relative to waterfront areas. The housing stock ranges from small single-family homes to pockets with higher rental concentration, which can create broader price bands.
What to watch: Mixed zoning and parcel sizes can make comparables variable. Focus on very recent sales on the same side of major corridors and validate days on market by sub-pocket.
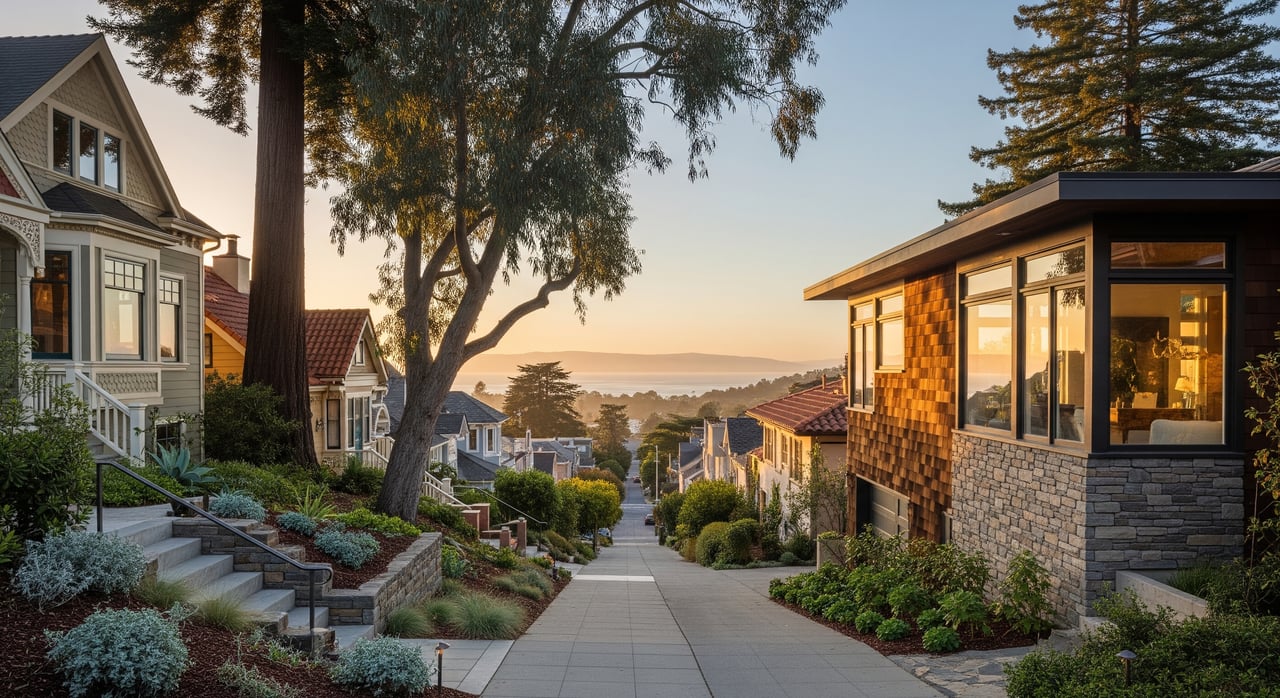
Downtown
Downtown delivers urban walkability with shops, restaurants, and cultural venues. You will find a mix of condos and small single-family homes, which creates more accessible entry points than many coastal streets. Buyers who prize convenience often favor this area, even with smaller outdoor spaces.
What to watch: HOA fees affect total cost of ownership for condos. Limited larger-lot supply can push competition for single-family listings.
Beach Flats
Beach Flats is close to the harbor and Boardwalk, with higher-density housing and a broader mix of multifamily and small-lot properties. Entry prices are often lower than nearby coastal neighborhoods. Some buyers see redevelopment potential over a longer horizon.
What to watch: Housing conditions vary by property. Because sales counts can be modest, a single outlier can skew medians. Compare multiple periods and confirm the sample size for your analysis.
Pleasure Point
Pleasure Point is synonymous with surf breaks, cliffside views, and a strong beach culture. Small lots and limited parking are common, and coastal proximity drives a premium for homes with views or near East Cliff Drive. Demand often includes lifestyle buyers and second-home purchasers.
What to watch: Bluff stability and erosion risk, along with coastal permitting, shape long-term ownership costs and renovation potential.
Quick compare: value signals by area
| Micro-neighborhood | Core value drivers | Typical housing mix | Key considerations |
|---|---|---|---|
| Westside | Larger lots, coastal access, residential feel | Mostly single-family, some remodels | Strong competition for larger lots, limited infill |
| Seabright | Immediate beach access, seasonal appeal | Older cottages, small bungalows | Flood and coastal permitting exposure, higher maintenance |
| Midtown | Central location, value relative to coast | Mix of single-family and rentals | Variable comps due to mixed zoning and parcel sizes |
| Downtown | Walkability to services and culture | Condos plus small SFR | HOA fees for condos, limited large-lot supply |
| Beach Flats | Affordability near coast and harbor | Higher-density, multifamily presence | Wide condition range, small sample sizes can skew data |
| Pleasure Point | Surf lifestyle, views, East Cliff proximity | Small-lot coastal SFR | Bluff erosion risk, parking and lot-size limits |
Turn neighborhood trends into decisions
Align your goals with value drivers
Start with how you will use the home. If you want everyday beach access and lifestyle, your search may center on Seabright or Pleasure Point, with a clear budget for premiums and maintenance. If you value yard space and consistent single-family demand, target Westside pockets. For a central location at a more accessible entry price, review Midtown and Downtown options.
Price and negotiate with the right metrics
Ask for a trailing 12-month snapshot of median sale price, price per square foot, median days on market, months of supply, list-to-sale price ratio, and number of closed sales for your exact micro-neighborhood. Validate housing mix, median lot size, and the share of cash sales to gauge investor activity. If the area has fewer than ten recent closings, smooth the data over 24 to 36 months and inspect individual comps.
Adjust for environmental and policy risk
Confirm whether the property sits in a FEMA flood zone or a bluff hazard area and consider potential insurance and financing impacts. If short-term rental income is part of your plan, review local registration rules and allowed zones before you buy. For future expansion, check how coastal permitting, SB9, and ADU standards apply on the parcel.
Data to request before you buy or sell
- Trailing 12- and 36-month medians for price and price per square foot by micro-neighborhood, with sample sizes.
- Median days on market, months of supply, and list-to-sale ratio for the same periods.
- Housing mix breakdown: single-family vs condo vs multi-unit, plus median lot size.
- Cash versus financed share of recent sales to estimate investor presence.
- Any FEMA flood zone, bluff erosion, or coastal overlay that applies to the parcel.
- Short-term rental registration requirements and recent permit counts in the area.
- Recent building permits, including ADUs and major remodels, to see supply trends.
Policy and climate factors to watch
- Coastal permitting can limit new supply and remodel scope near the water, which supports scarcity value but may lengthen project timelines.
- Sea-level rise, flooding, and bluff erosion can raise ownership costs, affect insurability, and narrow the buyer pool for exposed properties.
- Short-term rental rules influence investor demand near tourist corridors and can change revenue assumptions.
- SB9 and ADU streamlining may add incremental supply in some single-family zones, though coastal rules often limit impact near the shoreline.
Make a neighborhood plan
Focus on how you live day to day, then layer in hard data on pricing, time on market, and environmental exposure. Use the micro-neighborhood view rather than citywide averages so you price or bid with precision. When the sample size is small, review individual comps and stretch the time window so one outlier does not steer your decision.
If you want help pulling neighborhood-level reports, mapping coastal overlays, or planning upgrades that match local buyer demand, reach out to The Portola Group. We can walk you through your options and help you time your move.
FAQs
Which Santa Cruz neighborhoods hold value best?
- Neighborhoods with beach access, limited new supply, and convenient amenities often show strong long-term demand, but always review environmental exposure and current policy.
Is a beach property a better investment than inland?
- Beach areas can command premiums and attract more buyers, yet flood and bluff risks plus permitting and insurance can affect financing, carrying costs, and resale.
Are Midtown or Downtown better for resale?
- Both draw buyers who value central location and services; Downtown condos offer an accessible entry point while Midtown single-family homes provide variety and often broader price bands.
How much should micro-neighborhood trends influence my offer?
- Use recent comps, median days on market, and list-to-sale ratios for the exact pocket, then adjust for views, lot size, and condition while accounting for small sample sizes.
What data should I ask my agent to pull for Santa Cruz?
- Trailing 12- and 36-month medians, days on market, months of supply, list-to-sale ratio, housing mix, cash share, flood or bluff overlays, and any local STR or permit activity.